The Innovation ROI Playbook
How to Prioritize, Fund, and Prove the Value of Business Initiatives
Leaders no longer just want to know how many ideas were submitted. They want to know which initiatives deserve investment, and which ones are creating measurable business value.










Measuring Success Over Time
Innovation success develops in stages. Organizations must first invest in the processes, behaviors, and credibility needed to support innovation. As those foundations mature, the focus shifts from building the system to improving decision-making, implementation, and measurable business returns.
Where you need to invest changes over time. Early on, most of the time, budget, and attention goes into building the system. As it matures, that investment moves to running the system for results. Every program travels both journeys at once.
Innovation Transformation journey
Building the system. It needs the most investment at the start, and less as the foundations take hold.
- Establishing processes
- Encouraging collaboration
- Building credibility
- Fine-tuning/improving
Innovation Management journey
Running the system for results. It needs more investment over time, as more initiatives move toward decisions, implementation, and returns.
- Time to decision
- Idea selections
- Transitions to the business
- Implementation
- Return on investment
The tipping point comes when running the system starts to need more investment than building it. From there, the focus moves to measurable business returns, and the KPIs you track should move with it.

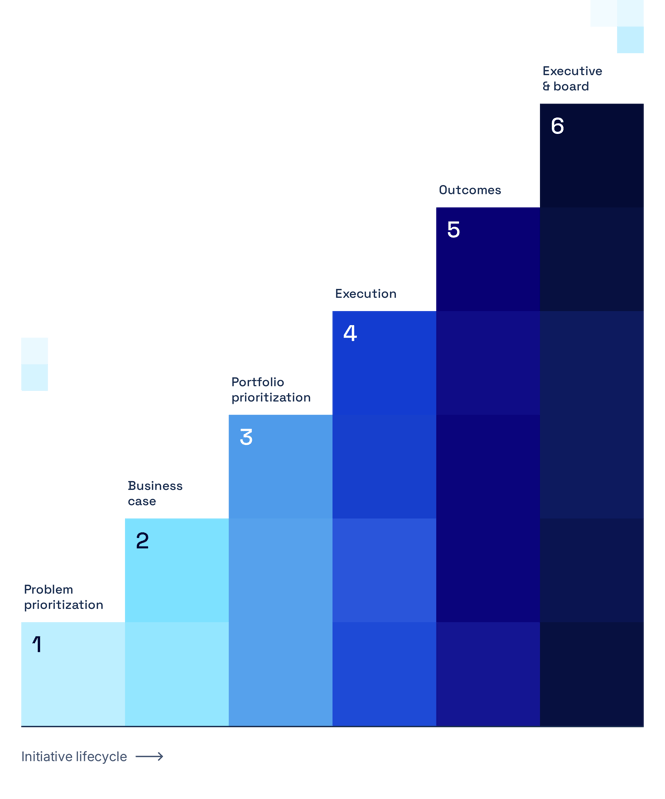
The Right KPIs at Each Stage of the Initiative Lifecycle
1. Problem Prioritization KPIs
Identify which problems are worth solving
Before building a business case, teams need to understand which problems matter most. Not every idea, challenge, or opportunity deserves the same level of attention. Use these KPIs to compare problems and prioritize where to focus.
Cost of inaction
What happens financially or strategically if the organization does nothing?
Business impact size
How large is the opportunity in terms of revenue, cost, productivity, risk, or customer value?
Strategic alignment
How closely does the problem connect to company priorities, transformation goals, or business unit objectives?
Urgency
How quickly does the organization need to act because of market pressure, customer expectations, regulation, AI disruption, or competitive movement?
Affected stakeholders
How many customers, employees, business units, processes, or markets are affected?
Current process inefficiency
How much time, cost, duplication, manual work, or delay does the current situation create?
Example:
A team identifies a manual approval process that affects 3,000 employees, delays decisions by 10 days, and creates duplicated work across five business units.
Possible prioritization KPIs:
-
Average delay per approval
-
Number of employees affected
-
Estimated hours lost per month
-
Cost of manual work
-
Risk of delayed customer delivery
-
Strategic relevance to operational efficiency goals
2. Business Case KPIs
Decide whether an initiative deserves funding
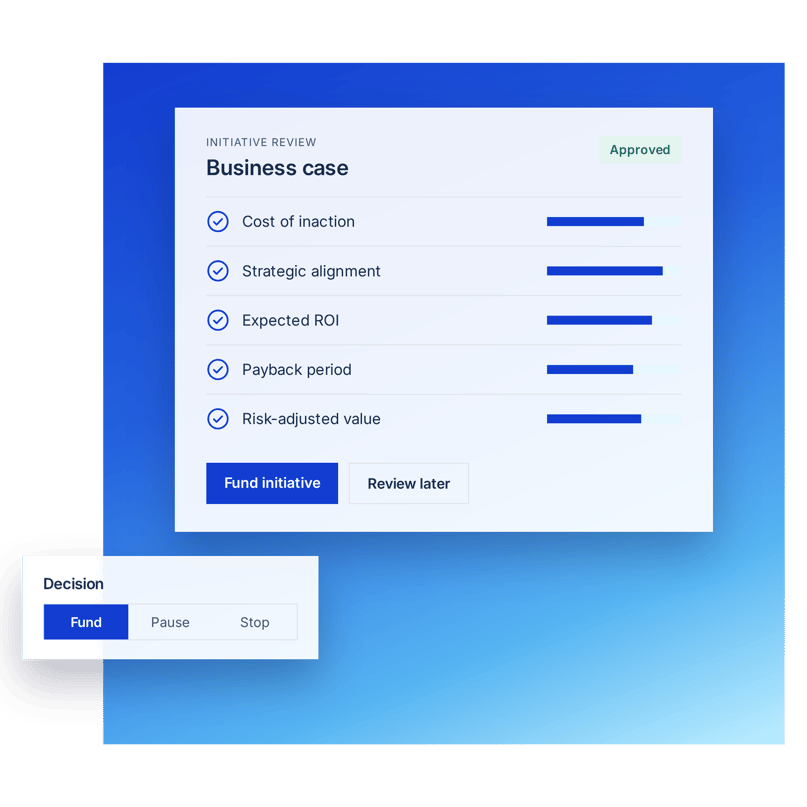
Once a problem has been prioritized, the next step is to evaluate whether the proposed initiative is worth investment. This is where teams need to move from qualitative justification to measurable value.
Expected ROI
Compares the financial benefit of an initiative to the investment required.
Formula: ROI = (Net Benefit ÷ Investment Cost) × 100
Payback period
Shows how long it will take for the initiative to recover its investment cost.
Formula: Payback Period = Initial Investment ÷ Annual Net Benefit
Net Present Value, or NPV
Estimates the value of future cash flows in today’s terms, using a discount rate.
EBITDA impact
Measures how the initiative may improve profitability through revenue growth, cost reduction, or margin expansion.
Cost savings potential
Estimates direct savings from reduced spend, lower manual effort, fewer errors, or improved process efficiency.
Revenue potential
Estimates new revenue, protected revenue, upsell potential, or market expansion.
Risk reduction value
Estimates the financial or strategic value of reducing compliance, operational, cybersecurity, supply chain, or market risk.
Example:
An AI workflow automation initiative requires a $1.5 million investment and is expected to reduce annual operating costs by $900,000.
Relevant KPIs:
-
ROI
-
Payback period
-
Annual cost savings
-
Productivity gain
-
EBITDA impact
-
Adoption rate
-
Time-to-value
3. Portfolio Prioritization KPIs
Compare initiatives and decide what to fund first
Most organizations have more opportunities than resources. Portfolio prioritization helps leaders compare initiatives consistently and focus investment where it can create the most value.
Value vs. effort
Compares expected impact against cost, complexity, and resource requirements.
Capital efficiency
Measures value created per dollar invested.
Formula: Capital Efficiency = Value Created ÷ Investment Cost
Strategic fit score
Evaluates how strongly the initiative supports strategic goals.
Risk-adjusted value
Adjusts expected value based on delivery risk, adoption risk, technical uncertainty, or market uncertainty.
Time-to-value
Estimates how quickly the initiative can begin producing measurable benefits.
Portfolio balance
Assesses whether the portfolio includes the right mix of short-term efficiency, medium-term growth, and long-term strategic bets.
Example:
Two initiatives both promise $5 million in value. One requires $500,000 and can deliver results in six months. The other requires $3 million and may take three years.
Portfolio KPIs help leaders compare not only the size of the opportunity, but the efficiency, timing, and risk of the investment.
4. Execution KPIs
Track whether initiatives are moving toward value
A strong business case is not enough. Initiatives often lose value during execution when ownership, milestones, risks, and outcomes are not visible. Execution KPIs help teams monitor whether approved initiatives are progressing toward the expected business impact.
Milestone progress
Tracks whether the initiative is moving through agreed phases and decision points.
Budget variance
Compares actual spend against planned investment.
Timeline variance
Measures whether delivery is ahead, on track, or delayed.
Risk status
Identifies risks that could affect cost, timing, adoption, or expected value.
Owner accountability
Clarifies who is responsible for progress, decisions, and next steps.
Adoption readiness
Measures whether users, teams, or business units are prepared to implement the change.
Forecasted vs. expected value
Compares the original business case with the current value forecast as new evidence becomes available.
5. Outcome KPIs
Prove whether the initiative delivered business impact
Outcome KPIs measure whether the initiative created the value it promised. These KPIs should be defined before execution begins, so teams can track realized impact after launch or implementation.
Realized cost savings
Actual savings achieved after implementation.
Revenue uplift
New or protected revenue created by the initiative.
Productivity gain
Improvement in output, cycle time, or revenue per employee.
Time-to-market improvement
Reduction in time required to launch, implement, or deliver.
Efficiency gain
Improvement in process speed, throughput, automation, or resource utilization.
Quality improvement
Reduction in errors, rework, defects, escalations, or service issues.
Adoption rate
Percentage of target users, teams, or business units using the new process, product, or capability.
Business impact realized vs. forecasted
Compares actual outcomes against the original business case.
6. Executive and Board-Level KPIs
Show how innovation contributes to enterprise value
At the executive level, innovation needs to connect to broader enterprise performance. These KPIs help communicate innovation as a disciplined investment portfolio, not a collection of disconnected experiments.
Portfolio ROI
Measures the total return across a portfolio of innovation or transformation initiatives.
Innovation vitality index
Measures the share of revenue generated from new products, services, business models, or capabilities.
Formula: Innovation Vitality Index = Revenue from New Offerings ÷ Total Revenue
Economic Value Added, or EVA
Measures whether an initiative creates value above the company’s cost of capital.
Formula: EVA = NOPAT - (Capital Invested × WACC)
EBITDA uplift
Shows how innovation contributes to profitability and margin expansion.
Enterprise value impact
Estimates how EBITDA improvements may influence company valuation.
Formula: Enterprise Value Impact = EBITDA Increase × Valuation Multiple
Strategic risk reduction
Measures how innovation reduces exposure to disruption, regulation, operational fragility, or market decline.
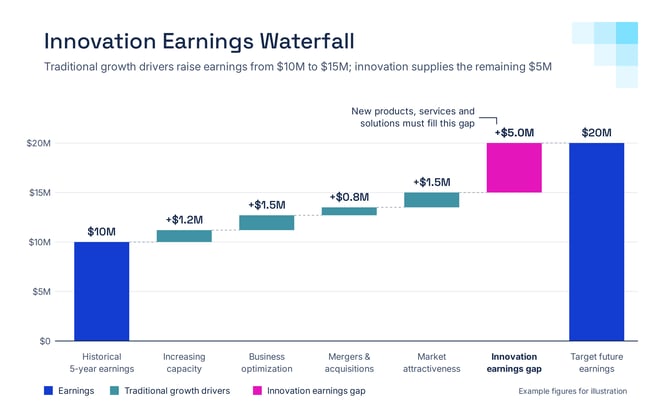
The Innovation Earnings Gap
The Innovation Earnings Gap is a useful way to communicate innovation to leadership teams. Build an earnings bridge showing the expected contribution from traditional growth levers, such as business optimization, increasing capacity, partnerships or acquisitions, and favorable market conditions. Then quantify the remaining earnings gap that can only be closed through new products, services, and solutions.
Presented as a waterfall chart, it provides a compelling visual narrative showing why innovation is essential to achieving future growth ambitions, rather than simply being a desirable activity.
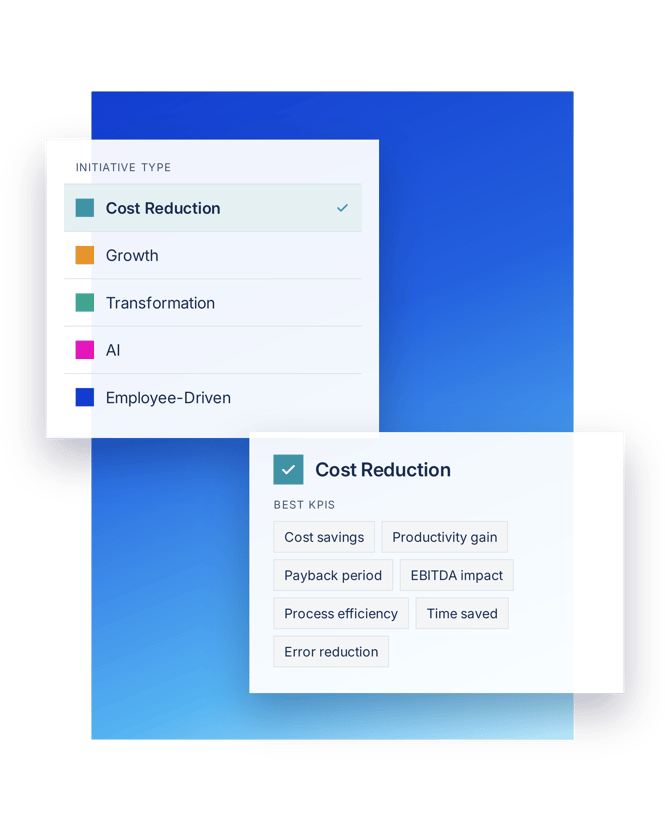
Choosing the Right KPI for the Right Initiative
Not every initiative should be measured the same way.
Cost Reduction Initiatives
Best KPIs
Cost savings, productivity gain, payback period, EBITDA impact, process efficiency, time saved, and error reduction.
Growth Initiatives
Best KPIs
Revenue potential, new revenue generated, market expansion, customer adoption, NPV, and innovation vitality index.
Transformation Initiatives
Best KPIs
Strategic alignment, milestone progress, adoption rate, risk reduction, capability improvement, and business impact realized vs. forecasted.
AI Initiatives
Best KPIs
Productivity gain, automation rate, cost reduction, time saved, quality improvement, adoption rate, and EBITDA impact.
Employee-Driven Initiatives
Best KPIs
Participation rate, implementation rate, savings generated, value per employee, engagement impact, and cycle-time reduction.
Stop Funding Initiatives You Can't Measure
HYPE connects every initiative to the KPIs that prove its value. Prioritize the right opportunities, track execution, and show leadership the return on every investment.